
Quantum EDGE automates tuning and optimizing superconducting quantum computers, cutting fundamental experiment times to seconds and simplifying complex tasks like randomized benchmarking.
You can focus on innovation while ensuring your quantum systems are ready for future success.
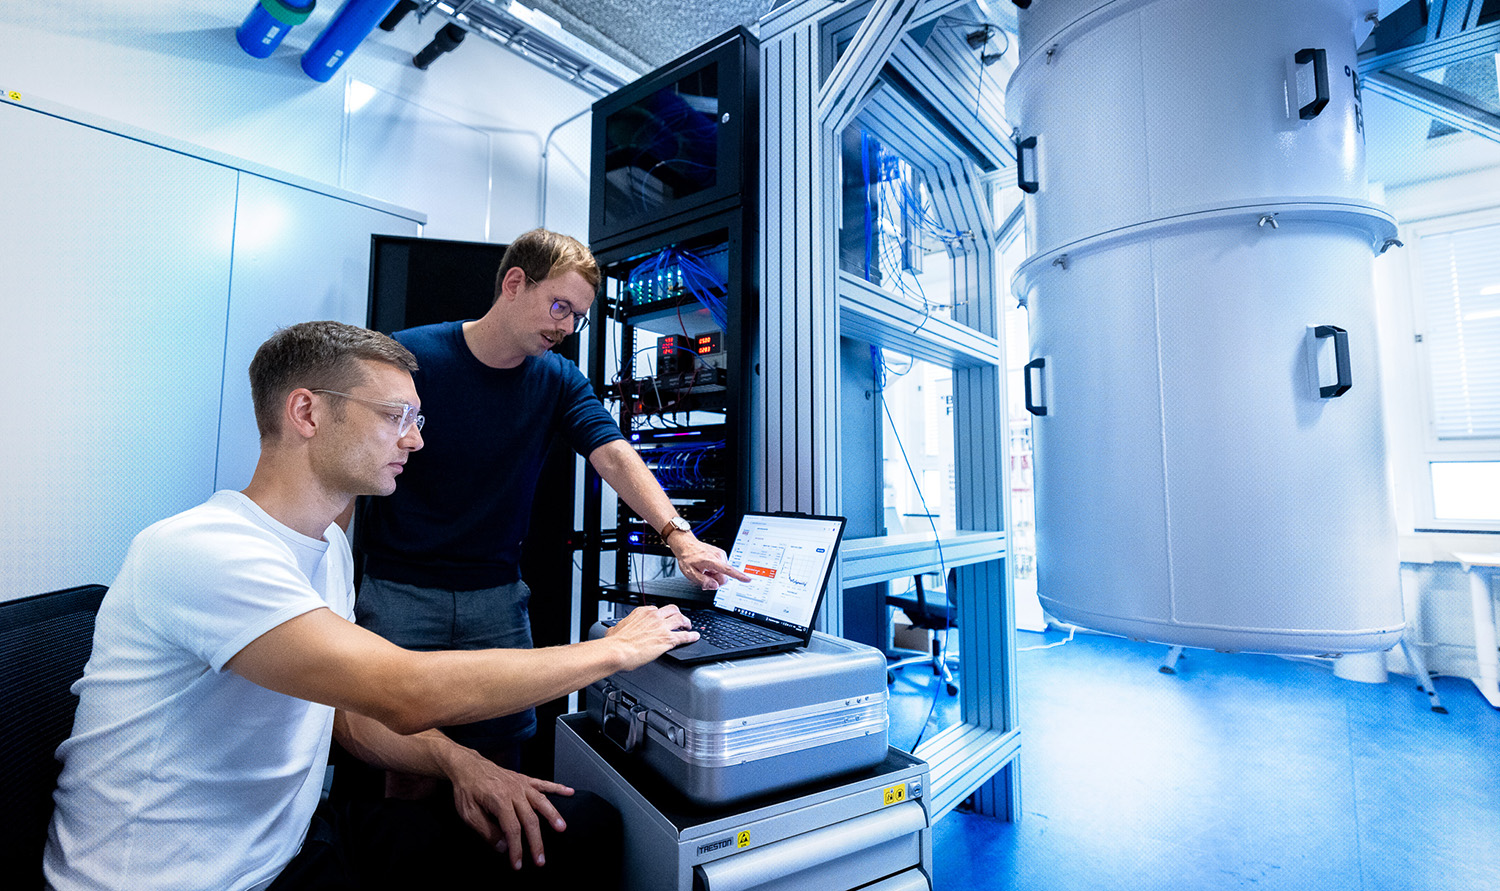










MORE THAN 100x FASTER
Bring-up – Characterization – Tuning

Quantum EDGE
Quantum EDGE is an advanced automation platform designed to streamline the tuning, optimization and scaling of quantum computers.
Whether you’re a pioneer aiming for future scalability, a researcher experimenting with smaller systems, or a scientist swamped by 2-qubit gate characterization, Quantum EDGE enhances your productivity by automating complex tasks and reducing experiment times to mere seconds.
With Quantum EDGE, you can focus on innovation while ensuring your quantum systems are ready for future success.
AUTOMATION IS THE ONLY WAY FORWARD.
See Quantum EDGE in action
Product features
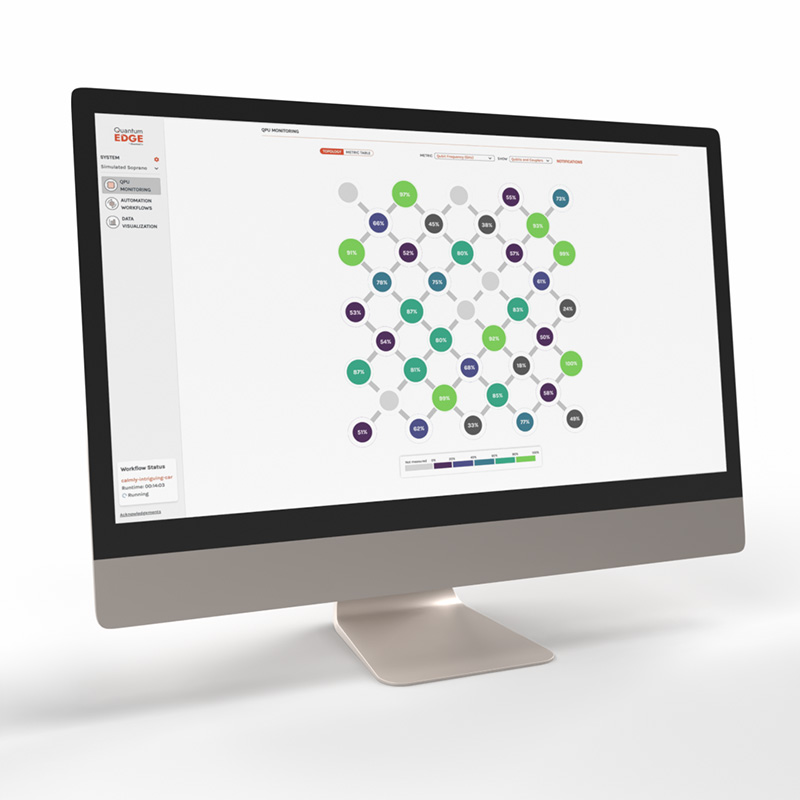
QPU MONITORING
The QPU Monitoring tool provides a graphical view of QPU topology with real-time updates on qubit performance metrics such as coherence times, gate fidelities and error rates. Users can adjust these metrics across hardware setups and integrate with major control electronics for detailed insights.
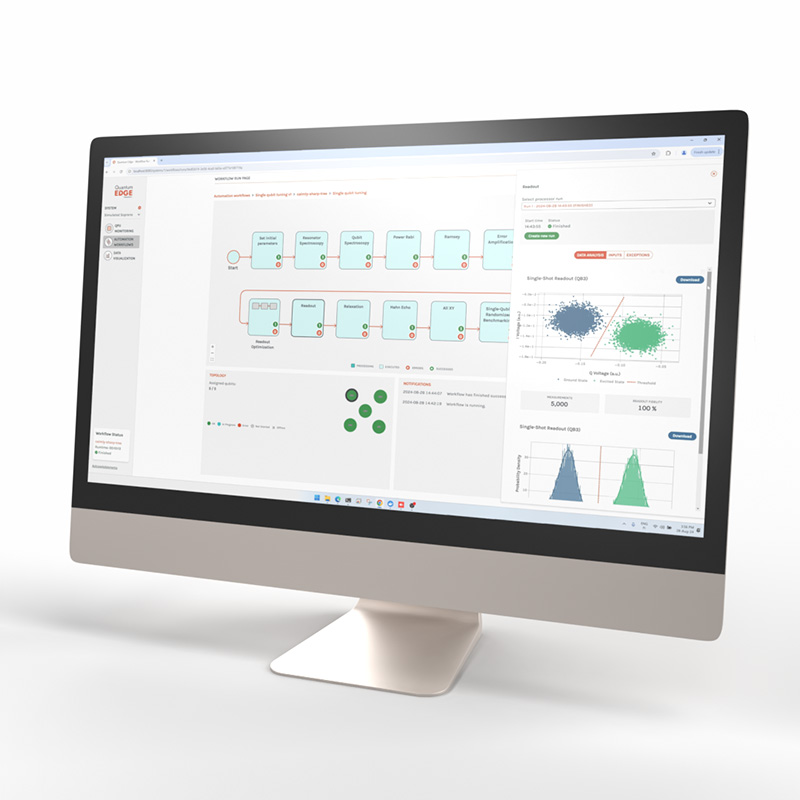
AUTOMATION WORKFLOWS
Quantum EDGE automates qubit bring-up, characterization and tuning on a QPU through tailored workflows. These workflows, comprising control segments for rapid measurements and detailed analysis, include QPU bring-up, single qubit optimization and 2-qubit gate operations. Users can customize and build workflows as needed, with options to debug and rerun from failure points. This automation boosts efficiency, accuracy and reliability, ensuring optimal quantum hardware performance.
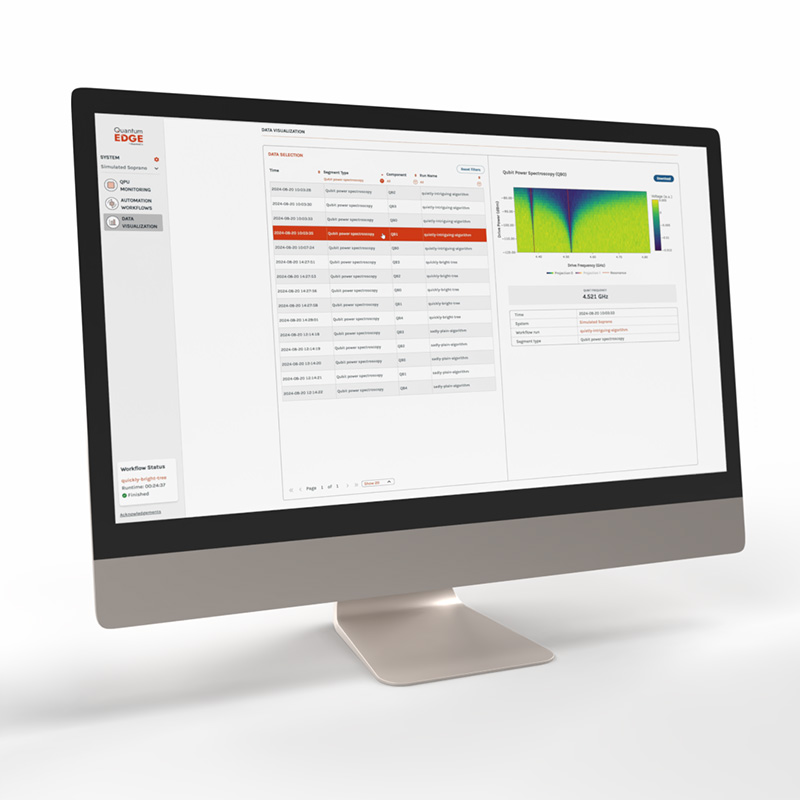
DATA VISUALIZATION
The Data visualization tool streamlines the extraction, visualization and interpretation of data through interactive plots, enabling quick debugging and deeper insights. You can easily explore data, prioritize key information, and share analysis results instantly with relevant teams.
Product highlights
Develop and scale up your qubits with Quantum EDGE
Pioneers Seeking Scalability
For forward-thinking innovators focused on the future of quantum computing, Quantum EDGE offers the path to scalability through essential automation, ensuring your systems are ready for tomorrow.
Researchers with Smaller Systems
Quantum EDGE serves as the perfect tool for researchers with smaller setups, enabling you to experiment, improve qubit quality and easily scale your systems when you’re ready.
Scientists Overburdened by 2-Qubit Gates
If you are a scientist slowed down by repetitive 1-qubit gate characterization, Quantum EDGE can automate those tasks, allowing you to focus on advancing development, such as improving 2-qubit gate fidelities.
FAQ
To use your software do I need to write the instrument drivers to run automation?
You don’t need to write drivers while using Quantum EDGE. We integrated the control electronics into our software.
If I want to change some instrument parameters, can I do it in the software?
For each experiment, we provided easy editing options through UI prompts as well as access to all the parameters we use through the YAML file.
If I want to measure several small chips but with different connectivity, how does Quantum EDGE accommodate this?
Yes, we provide configuration settings both for the chip and the instrument-chip connections. You can create new configurations any time.
How can I start using your software, is there a trial license?
Get in touch with us. We’d be happy to organize a trial for you.
What do I do if my experiments fail during automation?
We provide tools for you to troubleshoot and find the reason for failure. As you probably know there are different reasons experiments fail, but we allow you to check your measurement options to begin with and rerun your workflows once you resolve the issue.
I want to start with a small system with two qubits and want to measure bigger chips once I am happy with my qubit quality - will the software work?
Yes, the chip upgrade will work, it might require a license upgrade to larger chips but we would also be happy to test the upgrade and functionality with you.
Can I use the same workflow automation on different instruments?
Yes, you can use the existing workflows on different instruments we support. At this stage of the development, we still have some instruments more developed than others, but over time this will be expected for all the platforms.
I want to run an experiment specific to my qubits to test a specific functionality, can I do it through your platform?
For this it’s best to get in touch and we can start working together on adding the experiments you need. We will shortly be able to provide you with the means to write experiments yourself and add them to automation workflows.
How long does it take to perform bring-up and single qubit tuning workflows?
This depends a lot on the state of the noise, setup and the qubit but if all is in a good shape you should be able to perform bring-up and characterization of a single qubit from 5-10 minutes.
What type of qubits do you support?
We support superconducting qubits, mainly flux tunable transmons with and without tunable couplers.
Do you sell control instruments together with the software?
We don’t sell the instruments, for this you’ll need to speak with each provider. We can help you choose a stack based on your needs.
Integrated with





How to start using it? Let’s start together!
Getting started with Quantum EDGE is simple. Once we confirm your qubits have compatible control electronics (Qblox, Quantum Machines or Zurich Instruments), all you need is a software license.
Our engineer will handle the installation, and within 1-2 hours, your system will be configured and ready for experiments.
Our scientists will provide training, ensuring you are up and running quickly.
Start now with Quantum EDGE and stay ahead!
